- 【postgresql 基础入门】入门教程成形了,八大章节,涵盖库,表
- Python机器学习实战教程
- Leetcode-二叉树oj题
- Springboot 整合 Quartz(定时任务框架)
- Nginx快速入门:访问日志access.log参数详解 |访问日志记
- SpringBoot常用拦截器之ClientHttpRequestIn
- AI时代的Web开发:让Web开发更轻松
- Spring Boot集成knife4j
- 说一下Spring Security中@PermitAll和@PreA
- Spring Boot 启动报错解决:No active profil
- 基于Django美食菜谱网站和点评系统设计与实现(Pycharm+Py
- 高校心理教育辅导系统|基于Springboot的高校心理教育辅导系统设
- 【数据结构】链表面试题
- MySQL INSERT插入条件判断:如果不存在则插入
- Java项目实战--基于SpringBoot3.0开发仿12306高并
- Scrapy框架(高效爬虫)
- 【Rust】——项目实例:——命令行实例(一)
- 求组合数的三种算法
- MySQL中的any
- 30天拿下Rust之超级好用的“语法糖”
- 手把手教你打造自己的 AI 虚拟主播
- 使用Navicat导出导出 MySQL 数据库表结构、表数据到Exce
- Python+Mysql实现登录注册
- MySQL中EXISTS谓词作用及原理
- org.springframework.beans.factory.U
- SpringAI——Java生态接入LLM
- 事务及SpringBoot中的事务开启
- 投springer的期刊时,遇到的一些latex模板使用问题
- 使用vite+vue+flask实现一个简单的前后端交互效果
- 抓包工具:Sunny网络中间件
目录
前言
一、后台管理设计与实现
1、Model层
2、业务层
3、控制层
二、前端预警可视化设计与实现
1、网页结构
2、数据绑定
三、效果展示
总结
前言
在之前的几篇博客中,我们讲解了如何在Leaflet中进行预警信息提示效果,以及基于XxlCrawler进行中国地震台网信息的采集、入库以及如何进行反爬处理。博文目录如下,感兴趣的朋友可以点击标题进入:
| 序号 | 博客地址 |
| 1 | 基于Leaflet.js的Marker闪烁特效的实现-模拟预警 |
| 2 | 基于Java的XxlCrawler网络信息爬取实战-以中国地震台网为例 |
| 3 | 使用SpringBoot将中国地震台网数据保存PostGIS数据库实践 |
| 4 | 在Java中使用XxlCrawler时防止被反爬的几种方式 |
在实际应用中,我们不仅需要将数据及时的采集回来,同时也需要实现对数据进行可视化。不仅对二维数据的列表展示,同时还需要对数据进行空间可视化。
本文即对采集回来的中国地震台网数据进行预警可视化进行深入讲解。首先讲解后台的代码和功能设计,然后基于L.Icon.Pulse进行地震预警展示,最后展示预警可视化效果。地址灾害不可预测,但是我们在灾后应该快速提供应急救援,将尽量减少人民群众的生命财产损失。如果您目前也有类似的需求,不妨来博文中指导一二。
一、后台管理设计与实现
后台管理使用SpringBoot框架来开发,数据库访问层依然采用熟悉的Mybatis-Plus框架。本小节将主要基于MVC结构介绍后台的相关设计与实现。数据后台提供数据访问支持,为前台的数据展示提供有效支撑。
1、Model层
model层包含地震台网数据的实体类,在之前的博客中有过介绍,这里也将主要的代码分享出来。让大家在熟悉这部分代码时,不至于有不适感:
package com.yelang.project.extend.earthquake.domain.crawler;
import java.io.Serializable;
import java.math.BigDecimal;
import java.util.Date;
import com.baomidou.mybatisplus.annotation.TableField;
import com.baomidou.mybatisplus.annotation.TableId;
import com.baomidou.mybatisplus.annotation.TableName;
import com.google.gson.annotations.SerializedName;
import com.yelang.framework.handler.PgGeometryTypeHandler;
import lombok.AllArgsConstructor;
import lombok.Data;
import lombok.NoArgsConstructor;
import lombok.ToString;
@Data
@ToString
@AllArgsConstructor
@NoArgsConstructor
@TableName(value ="biz_ceic_earthquake",autoResultMap = true)
public class CeicEarthquake implements Serializable{
	private static final long serialVersionUID = -1212153879708670015L;
	@TableId(value="pk_id")
	private Long pkId;//主键
	@SerializedName("AUTO_FLAG")
	@TableField(value="auto_flag")
	private String autoFlag;
	@SerializedName("CATA_ID")
	@TableField(value="cata_id")
	private String cataId;
	@SerializedName("CATA_TYPE")
	@TableField(value="cata_type")
	private String cataType;
	@SerializedName("EPI_DEPTH")
	@TableField(value="epi_depth")
	private BigDecimal epiDepth = new BigDecimal("0.0");
	@SerializedName("EPI_LAT")
	@TableField(value="epi_lat")
	private String epiLat;//纬度
	@SerializedName("EPI_LON")
	@TableField(value="epi_lon")
	private String epiLon;
	@SerializedName("EQ_CATA_TYPE")
	@TableField(value="eq_cata_type")
	private String eqCataType;
	@SerializedName("EQ_TYPE")
	@TableField(value="eq_type")
	private String eqType;
	@SerializedName("IS_DEL")
	@TableField(value="is_del")
	private String isDel;
	@SerializedName("LOCATION_C")
	@TableField(value="location_c")
	private String locationC;
	@SerializedName("LOCATION_S")
	@TableField(value="location_s")
	private String locationS;
	@SerializedName("LOC_STN")
	@TableField(value="loc_stn")
	private String locStn;
	@SerializedName("M")
	@TableField(value="m")
	private String m;
	@SerializedName("M_MB")
	@TableField(value="mmb")
	private String mmb;
	@SerializedName("M_MB2")
	@TableField(value="mmb2")
	private String mmb2;
	@SerializedName("M_ML")
	@TableField(value="mml")
	private String mml;
	@SerializedName("M_MS")
	@TableField(value="mms")
	private String mms;
	@SerializedName("M_MS7")
	@TableField(value="mms7")
	private String mms7;
	@SerializedName("NEW_DID")
	@TableField(value="new_did")
	private String newDid;
	@SerializedName("O_TIME")
	@TableField(value="o_time")
	private Date oTime;
	@SerializedName("O_TIME_FRA")
	@TableField(value="o_time_fra")
	private String oTimeFra;
	@SerializedName("SAVE_TIME")
	@TableField(value="save_time")
	private Date saveTime;
	@SerializedName("SUM_STN")
	@TableField(value="sum_stn")
	private String sumStn;
	@SerializedName("SYNC_TIME")
	@TableField(value="sync_time")
	private Date syncTime;
	@SerializedName("id")
	@TableField(value="epi_id")
	private String epiId;
	@TableField(typeHandler = PgGeometryTypeHandler.class)
	private String geom;
	@TableField(exist=false)
	private String geomJson;
}
Maper层没有其它特殊的业务,仅实现了基础的BaseMapper,方法体内没有扩展业务。在此不再赘述。
2、业务层
业务层作为控制层和模型层的中间层,主要负责数据的传递以及业务逻辑的处理。在地震可视化中,需要扩展的方法是需要提供按照震中位置和震级进行模糊 查询,同时提供按照地震主键查询地震详情的接口。在进行地震预警时,通过ajax获取详情实现地震位置的可视化。
根据震中位置和震级模糊查询的核心方法如下:
@Override public ListgetList(CeicEarthquake earthquake) { QueryWrapper queryWrapper = new QueryWrapper (); if (StringUtils.isNotBlank(earthquake.getLocationC())) { queryWrapper.like("location_c", earthquake.getLocationC()); } if (StringUtils.isNotBlank(earthquake.getM())) { queryWrapper.eq("m", earthquake.getM()); } queryWrapper.orderByDesc("o_time"); return this.baseMapper.selectList(queryWrapper); }
3、控制层
控制层是对接前台,接收前台请求,调用业务层的业务方法,查询相关数据或者保存相关数据的入口。前端地图展示和列表展示都是通过控制层实现。在控制层中,主要实现以下三个方法:
| 序号 | 方法 | 说明 |
| 1 | public String index() | 跳转到首页 |
| 2 | public TableDataInfo list(CeicEarthquake earthquake) | 根据震中位置和震级查询信息 |
| 3 | public AjaxResult detail(@PathVariable("pkId")Long pkId) | 根据数据ID查询数据详情 |
关键代码如下:
package com.yelang.project.extend.earthquake.controller;
import java.util.List;
import org.apache.shiro.authz.annotation.RequiresPermissions;
import org.springframework.beans.factory.annotation.Autowired;
import org.springframework.stereotype.Controller;
import org.springframework.web.bind.annotation.GetMapping;
import org.springframework.web.bind.annotation.PathVariable;
import org.springframework.web.bind.annotation.PostMapping;
import org.springframework.web.bind.annotation.RequestMapping;
import org.springframework.web.bind.annotation.ResponseBody;
import com.yelang.framework.aspectj.lang.annotation.Log;
import com.yelang.framework.aspectj.lang.enums.BusinessType;
import com.yelang.framework.web.controller.BaseController;
import com.yelang.framework.web.domain.AjaxResult;
import com.yelang.framework.web.page.TableDataInfo;
import com.yelang.project.extend.earthquake.domain.EarthquakeInfo;
import com.yelang.project.extend.earthquake.domain.crawler.CeicEarthquake;
import com.yelang.project.extend.earthquake.service.ICeicEarthquakeService;
@Controller
@RequestMapping("/ceiceq/info")
public class CeicEarthquakeInfoController extends BaseController{
	private String prefix = "ceicearthquake/info";
    @Autowired
    private ICeicEarthquakeService ceicEarthQuakeService;
    @RequiresPermissions("ceiceq:info:view")
    @GetMapping()
    public String index(){
        return prefix + "/index";
    }
    @RequiresPermissions("ceiceq:info:list")
    @PostMapping("/list")
    @ResponseBody
    public TableDataInfo list(CeicEarthquake earthquake){
        startPage();
        List list = ceicEarthQuakeService.getList(earthquake);
        return getDataTable(list);
    }

    @PostMapping("/detail/{pkId}")
    @ResponseBody
    public AjaxResult detail(@PathVariable("pkId")Long pkId){
        AjaxResult ar = AjaxResult.success();
        ar.put("data", ceicEarthQuakeService.getById(pkId));
        return ar;
    }
}
到此,我们已经将相关的服务接口开发完成,同时完成了对数据库数据的访问和调用。在完成后端的应用开发之后,我们来进行前端可视化的开发。
二、前端预警可视化设计与实现
为了在前端方便的对地震信息进行综合展示,我们计划将数据和底图使用Leaflet来进行集成。使用之前介绍过的预警信息实现方式。本小节主要是面向前端的设计与实现。
1、网页结构
为了比较直观的展示信息,同时将列表和地图定位技术进行结合。我们决定采用栅格布局的模式,台网地震信息和地图分别占50%。在html的框架中大致采用如下的结构来展示:
导出
2、数据绑定
在定义好网页框架结构之后,我们需要将列表和后台的接口进行对接,同时将地图和底图进行绑定。关于如何在Leaflet中进行底图绑定,应该很多朋友都比较了解了。这里不再进行过多的说明。这里仅说明如何进行table的绑定和预警可视化。
table绑定:为了将地震信息,如震发地点、震级、地震深度、经纬度等信息在列表中展示出来。这里采用layui的table组件。数据绑定的关键代码如下:
var options = {
         url: prefix + "/list",
         exportUrl: prefix + "/export",
         modalName: "台网地震信息",
         columns: [
         {
              field: 'id',
              title: '',
              visible: false
         },
         {
            field: 'locationC',
            title: '震中位置',
            formatter: function(value, row, index) {
           return parseFloat(row.m) >= '6.0' ? ""+ value +"" : value;
                    }
                },
                {
                    field: 'epiLon',
                    title: '经度',
                    formatter: function(value, row, index) {
                        return parseFloat(row.m) >= '6.0' ? ""+ value +"" : value;
                    }
                },
                {
                    field: 'epiLat',
                    title: '纬度',
                    formatter: function(value, row, index) {
                        return parseFloat(row.m) >= '6.0' ? ""+ value +"" : value;
                    }

                },
                {
                    field: 'm',
                    title: '震级',
                    formatter: function(value, row, index) {
                        return parseFloat(row.m) >= '6.0' ? ""+ value +"" : value;
                    }
                },
                {
                    field: 'epiDepth',
                    title: '深度',
                    formatter: function(value, row, index) {
                        return parseFloat(row.m) >= '6.0' ? ""+ value +"" : value;
                    }
                },
                {
                	field: 'otime',
                    title: '发震时间',
                    formatter: function(value, row, index) {
                        return parseFloat(row.m) >= '6.0' ? ""+ value +"" : value;
                    }
                },
                {
                    title: '操作',
                    align: 'center',
                    formatter: function(value, row, index) {
                        var actions = [];
                        actions.push(' ');
                        return actions.join('');
                    }
                }]
            };
            $.table.init(options);
预警绑定:预警信息绑定是参考中国地震台网的信息,在列表中点击地震信息,在右边的地图中可以直接定位,同时点击预警点,可以把相应的主要信息以弹窗的形式展示出来。这里的主要逻辑就是通过ajax去后台查询台网地震信息详情。然后根据经纬度绑定marker,同时将marker在地图上进行展示。
function preview(pkId){
        	$.ajax({
		        type:"post",
		        url:prefix + "/detail/" + pkId,
		        dataType:"json",
		        cache:false,
		        processData:false,
		        success:function(result){
		        	if(result.code == web_status.SUCCESS){
		        		var eqInfo = result.data;
		        		var content = "发震时间:"+eqInfo.otime + "
震中位置:"+eqInfo.locationC;
    				    content += "
震源深度(千米):"+eqInfo.epiDepth + "
震级:"+eqInfo.m;
		        		var marker = L.marker([eqInfo.epiLat, eqInfo.epiLon],
		        				{icon: L.icon.pulse({iconSize:[25,25],color:'#e50b3d',fillColor:"#e50b3d"})}).bindPopup(content).addTo(mymap);
		        	    showLayerGroup.clearLayers();
		        		showLayerGroup.addLayer(marker);
		        		mymap.setView(showLayerGroup.getBounds().getCenter(),8);//同时设置中心位置和级别
		        	}
		        },
		        error:function(){
		        	$.modal.alertWarning("获取信息失败");
		        }
		    });
        }
至此,前端的主要代码也编写完毕,最后我们将工程启动起来,然后进行前后台的联调。 展示最终的效果。
三、效果展示
本小节主要展示基于SpringBoot和Leaflet的地震台网信息预警可视化效果。从列表搜索到地图定位,让大家对开发出来的效果有一个直观的感受。同时为了将大于(含)6级的地震信息进行醒目的提示,在列表中我们对这些数据进行标红。

默认系统功能界面
默认情况下,列表的搜索功能是关闭的,如果您在使用过程中需要进行数据检索,可以点击搜索按钮打开检索栏。
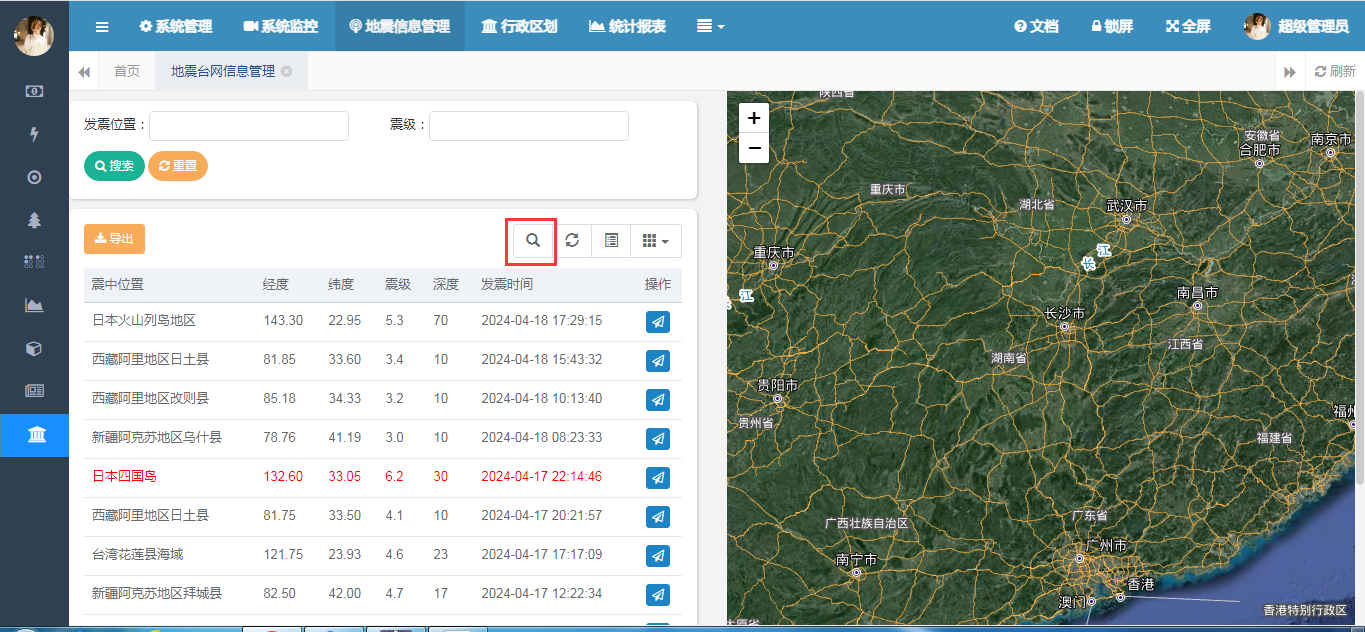
系统检索支持页面
在系统中,点击操作按钮栏中的定位功能。会自动实现当前地震信息在地图上的定位。
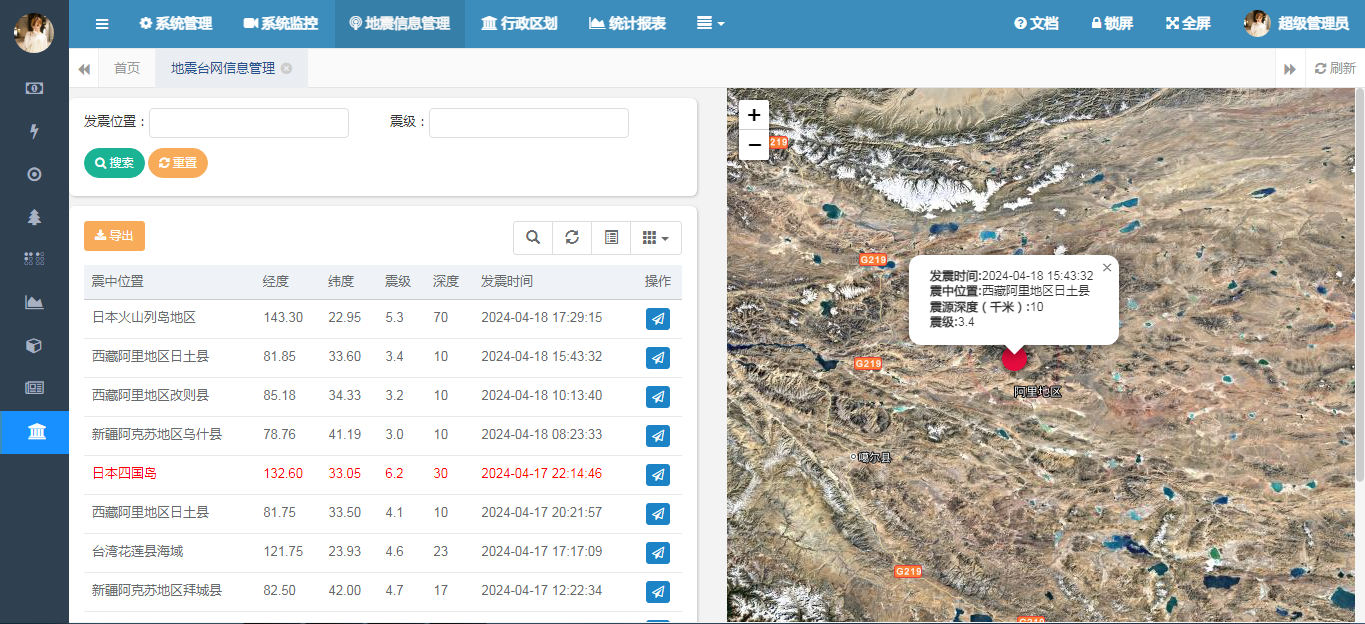
地震地图定位示意图
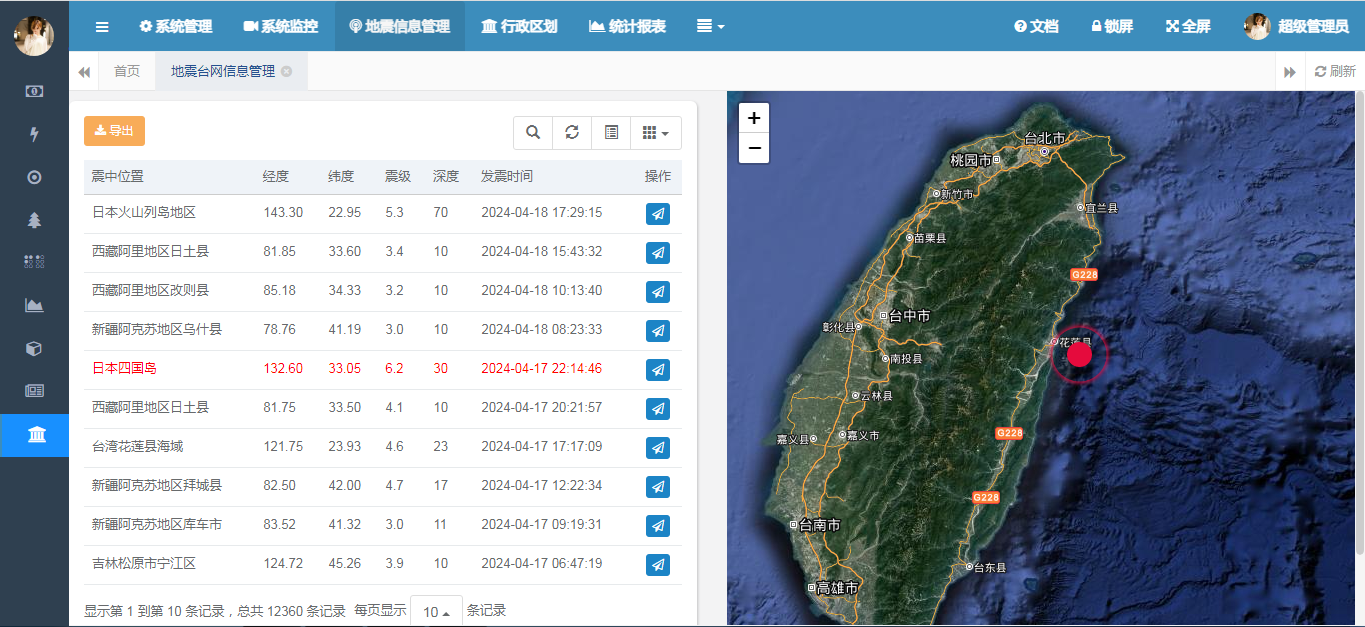
台湾花莲某地地震
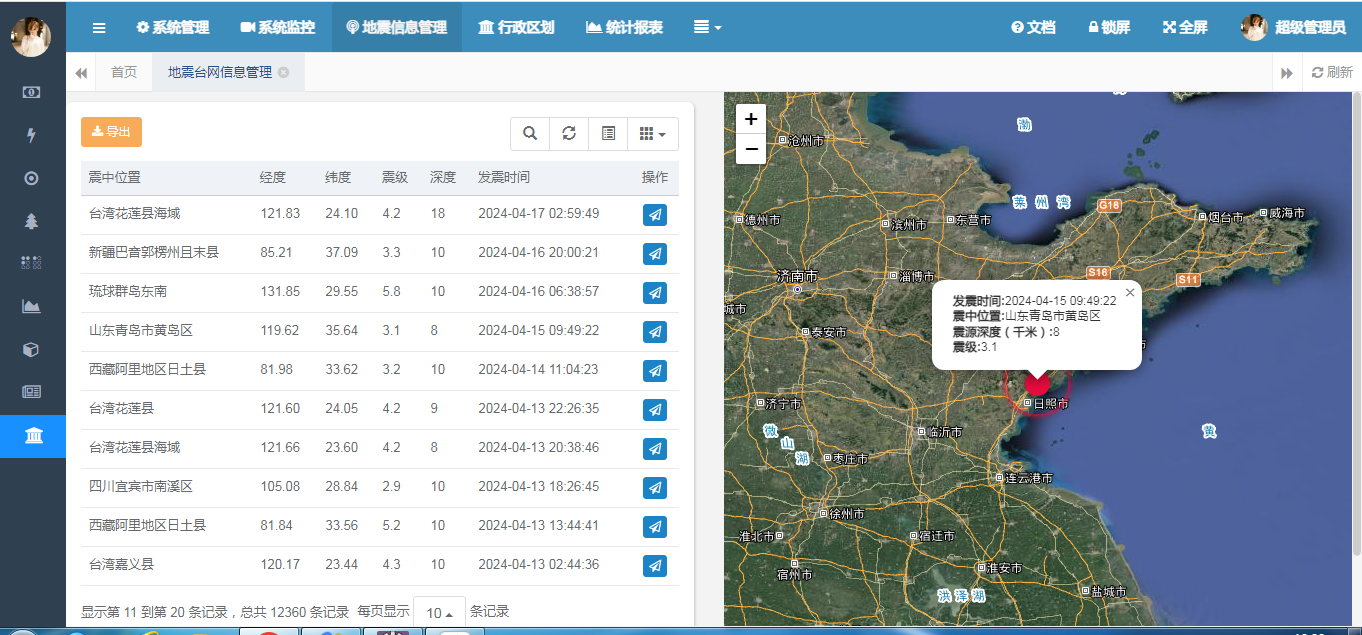
青岛某地地震示意图
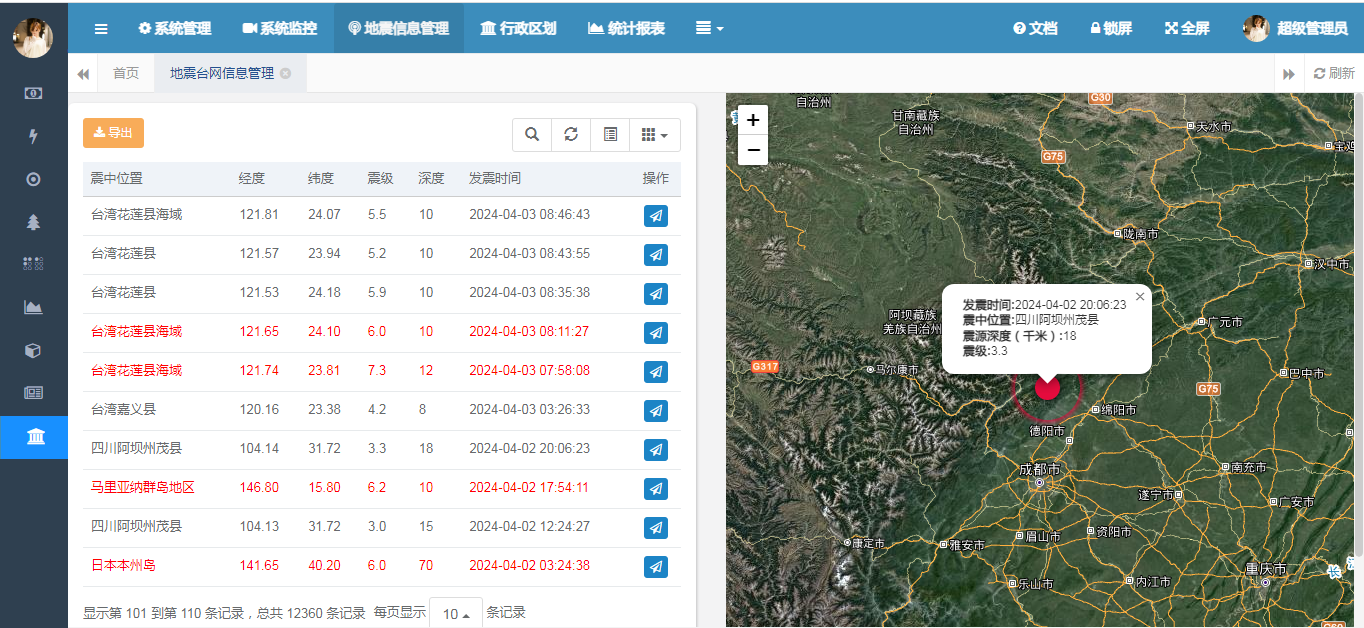
四川某地地震示意图
总结
以上就是本文的主要内容, 本文即对采集回来的中国地震台网数据进行预警可视化进行深入讲解。首先讲解后台的代码和功能设计,然后基于L.Icon.Pulse进行地震预警展示,最后展示预警可视化效果。地址灾害不可预测,但是我们在灾后应该快速提供应急救援,将尽量减少人民群众的生命财产损失。行文仓促,定有不足之处,不管是批评或者指导,不妨来博文中指导一二,不胜感激。


