相关推荐recommended
- 爬虫 — App 爬虫(一)
- Spring Cloud Gateway 过滤器 StripPrefi
- 【Python数据分析案例】——中国高票房电影分析(爬虫获取数据及分析
- 【Intellij idea】-- idea.vmoptions 目录
- @Builder注解使用
- Spring3新特性:Graalvm打包Springboot+Myba
- VL171 VL170配合LDR6020的type-c母座显示器方案
- Go:如何在GoLand中引用github.com中的第三方包
- SpringBoot-集成Minio
- Kotlin程序设计(二)面向对象
- 【Python三种打包方式】分别使用PyInstaller &
- java
- 基于python+django+爬虫豆瓣电影数据可视化分析系统的设计与
- 基于Python+Django的图书馆管理系统(内附源代码+部署教程)
- 【微服务笔记17】微服务组件之Gateway实现动态路由、配置路由规则
- 案例26:基于Springboot校园社团管理系统开题报告
- Java SpringBoot实现本地上传文件到resources目录
- spark-udf函数
- 2024三掌柜赠书活动第三期:Rust系统编程
- Rust 最新版1.75.0升级记
- nginx conf配置篇,如何配置.conf文件
- mysql binlog 日志详解及恢复
- 详解MySQL原生Online DDL:从历史演进到原理及使用
- 数据库如何删除数据
- springboot-结合前端实现网页跳转
- 【解决办法】Property ‘sqlSessionFactory‘
- 【MySQL异常解决】MySQL执行SQL文件出现【Unknown c
- DataGrip连接数据库设置(MySQL、Oracle、SQL Se
- 【MySQL】表的增删改查
- 计算机毕业设计springboot基于微信小程序的综合旅游管理系统的设
爬虫入门指南(8): 编写天气数据爬虫程序,实现可视化分析
作者:mmseoamin日期:2024-01-18
文章目录
- 前言
- 准备工作
- 爬取天气数据
- 可视化分析
- 完整代码
- 解释说明
- 运行效果
- 完结
前言
天气变化是生活中一个重要的因素,了解天气状况可以帮助我们合理安排活动和做出决策。本文介绍了如何使用Python编写一个简单的天气数据爬虫程序,通过爬取指定网站上的天气数据,并使用Matplotlib库对数据进行可视化分析。通过这个例子,我们不仅可以学习Python的相关库的使用,还可以探索天气数据的规律和趋势。

准备工作
在开始之前,确保你已经安装了所需的Python库:requests, BeautifulSoup和Matplotlib。你可以使用pip来安装它们,命令如下:
pip install requests beautifulsoup4 matplotlib
爬取天气数据

首先,我们需要确定要爬取的天气数据的来源。在这个例子中,我们选择了中国天气网(http://www.weather.com.cn/)上的天气数据。 我们爬取了北京市的天气数据。
代码中的 get_weather_data 函数负责发送HTTP请求并解析网页内容。首先,我们使用requests库向指定的URL发送GET请求,并指定编码为utf-8。然后,我们使用BeautifulSoup库解析网页内容,并通过CSS选择器获取温度数据。最后,把温度数据存储到一个列表中,并返回该列表。
以下是爬取天气数据的步骤:
- 导入所需的库:
import requests
from bs4 import BeautifulSoup
- 定义一个get_weather_data函数,用于发送HTTP请求并解析网页内容:
def get_weather_data(): url = 'http://www.weather.com.cn/weather/101010100.shtml' # 北京天气预报页面的URL response = requests.get(url) # 发送GET请求 response.encoding = 'utf-8' # 设置编码为utf-8 soup = BeautifulSoup(response.text, 'html.parser') # 使用BeautifulSoup解析网页内容 temperatures = [] # 存储温度数据的列表 temperature_elements = soup.select('.tem i') # 使用CSS选择器获取温度数据的HTML元素 for element in temperature_elements: temperatures.append(element.text) # 提取温度数据并添加到列表中 return temperatures # 返回温度数据列表- 调用get_weather_data函数来获取天气数据:
weather_data = get_weather_data()
可视化分析
- 导入所需的库:
import matplotlib.pyplot as plt
- 定义一个plot_weather_data函数,用于绘制折线图展示温度随时间的变化趋势:
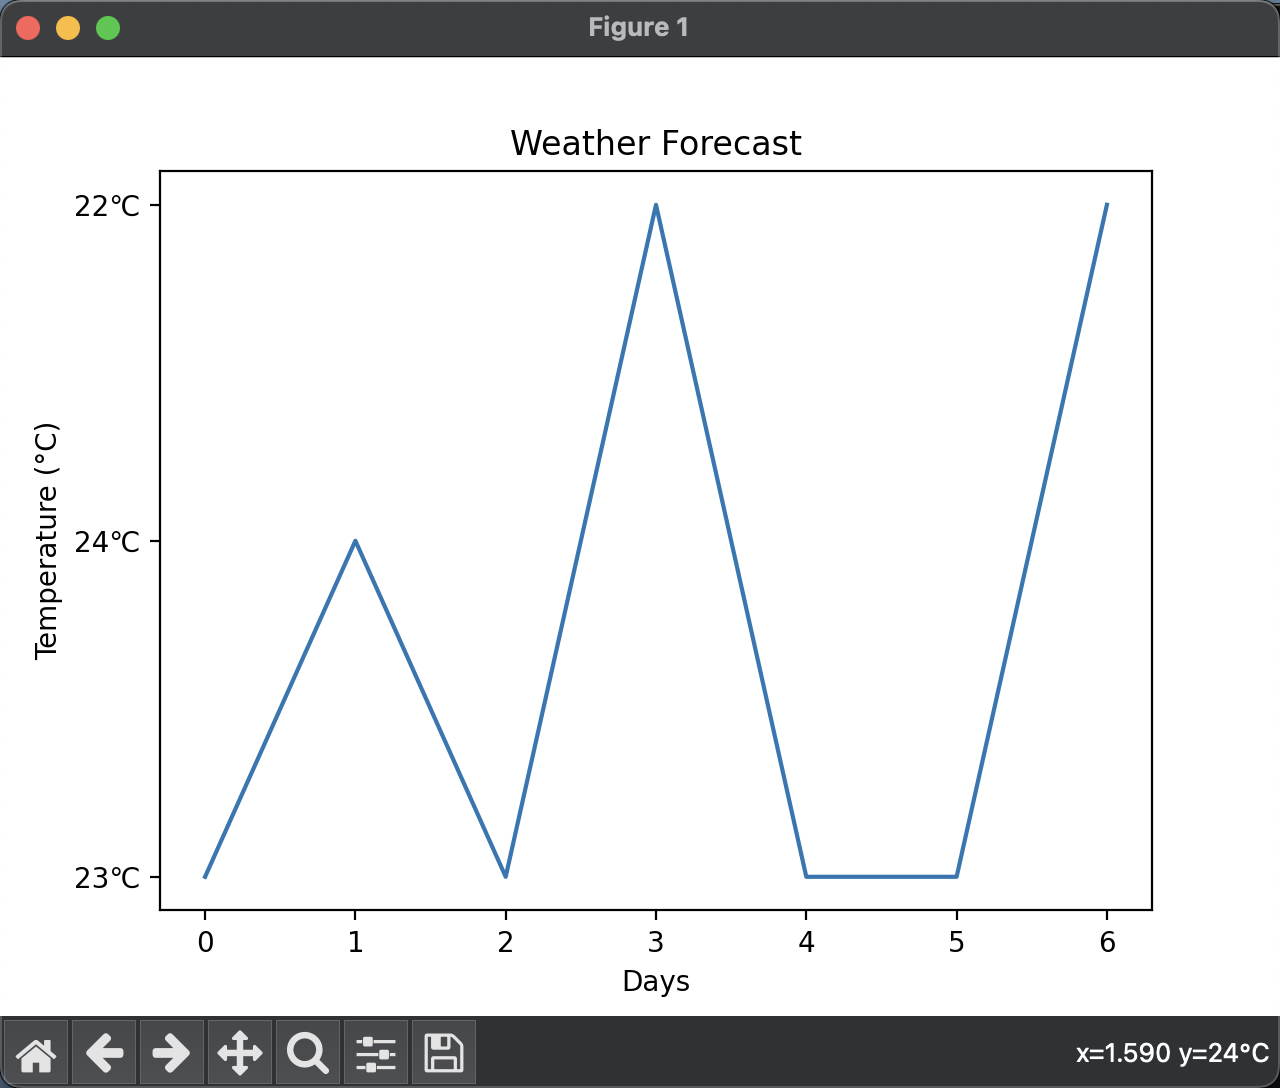
def plot_weather_data(temperatures): plt.plot(temperatures) # 绘制折线图 plt.title('Weather Forecast') # 设置图表标题 plt.xlabel('Days') # 设置X轴标签 plt.ylabel('Temperature (°C)') # 设置Y轴标签 plt.show() # 显示图表- 调用plot_weather_data函数来绘制折线图:
plot_weather_data(weather_data)
完整代码
import requests  # 导入requests库,用于发送HTTP请求
from bs4 import BeautifulSoup  # 导入BeautifulSoup库,用于解析网页内容
import matplotlib.pyplot as plt  # 导入Matplotlib库,用于数据可视化
def get_weather_data():
    url = 'http://www.weather.com.cn/weather/101010100.shtml'  # 天气预报页面的URL
    response = requests.get(url)  # 发送GET请求,获取网页内容
    response.encoding = 'utf-8'  # 设置编码为utf-8,确保正确解析中文
    soup = BeautifulSoup(response.text, 'html.parser')  # 使用BeautifulSoup解析网页内容
    temperatures = []  # 存储温度数据的列表
    temperature_elements = soup.select('.tem i')  # 使用CSS选择器获取温度数据的HTML元素
    for element in temperature_elements:
        temperatures.append(element.text)  # 提取温度数据并添加到列表中
    return temperatures  # 返回温度数据列表
def plot_weather_data(temperatures):
    plt.plot(temperatures)  # 绘制折线图
    plt.title('Weather Forecast')  # 设置图表标题
    plt.xlabel('Days')  # 设置X轴标签
    plt.ylabel('Temperature (°C)')  # 设置Y轴标签
    plt.show()  # 显示图表
if __name__ == '__main__':
    weather_data = get_weather_data()  # 获取天气数据
    plot_weather_data(weather_data)  # 绘制天气数据的折线图
解释说明
-
导入必要的库:
- 使用import requests导入requests库,用于发送HTTP请求。
- 使用from bs4 import BeautifulSoup导入BeautifulSoup库,用于解析网页内容。
- 使用import matplotlib.pyplot as plt导入matplotlib.pyplot库,用于数据可视化。
-
定义get_weather_data函数:
- 定义url变量,存储天气预报页面的URL。
- 使用requests.get(url)发送GET请求,获取网页内容。
- 将编码设置为utf-8,以确保正确解析中文。
- 使用BeautifulSoup(response.text, 'html.parser')解析网页内容。
- 定义一个空列表temperatures,用于存储温度数据。
- 使用CSS选择器.tem i定位到温度数据的HTML元素。
- 遍历温度元素,将温度数据提取并添加到temperatures列表中。
- 最后返回温度数据列表。
-
定义plot_weather_data函数:
- 使用plt.plot(temperatures)绘制折线图,传入温度数据列表作为参数。
- 使用plt.title设置图表标题为"Weather Forecast"。
- 使用plt.xlabel设置X轴标签为"Days"。
- 使用plt.ylabel设置Y轴标签为"Temperature (°C)"。
- 使用plt.show显示图表。
-
在主程序中执行:
- 使用get_weather_data函数获取天气数据,并将结果存储在weather_data变量中。
- 使用plot_weather_data函数,传入天气数据列表作为参数,绘制天气数据的折线图。
运行效果

完结
历时一个星期 终于将爬虫这点东西搞完了, 可能会有写欠缺,但是也还好, 希望可以帮助各位辛勤劳作的朋友

-
- 调用plot_weather_data函数来绘制折线图:
- 定义一个plot_weather_data函数,用于绘制折线图展示温度随时间的变化趋势:
- 导入所需的库:
- 调用get_weather_data函数来获取天气数据:
- 定义一个get_weather_data函数,用于发送HTTP请求并解析网页内容:
- 导入所需的库:


